Theratechnologies Inc. (TSX:TH) powered to a high of $5.05 today after the company announced positive clinical results for its HIV-related visceral fat treatment. Volume of trading in TH surged to over 3.6-million by midday. TH had been a Stock Trends TSX Portfolio holding until it was stopped out at $2.52 on November 30th. Evidently, the trade could have scored a lot better than the 5% gain it managed for the TH holding.
For a complete trading history of the Stock Trends TSX Portfolio see http://www.stocktrends.ca/stonline/stp-tsx1.php
Stock Trends Report for Theratechnologies Inc. TH
http://www.stocktrends.ca/?symbol=TH-T&page=streport

Tuesday, December 19, 2006
Monday, December 18, 2006
RIM turbulent, but in motion
Compared to the first two months of the final quarter of 2006, December has been challenging for Research in Motion Ltd. (NASDAQ:RIMM, TSX:RIM) shareholders. After rallying in powerhouse fashion to its 52-week high in the last week of November, the stock hit resistance and retreated almost 12% last week. A support rally closed out the week, with the stock closing near the top of its weekly tick. Trading will again be active and volatile this week as the company announces its Q3 earnings. RIM is a current Stock Trends Portfolio holding and has returned 56% since its BUY signal on September 21.
Tuesday, November 28, 2006
Boeing, Boing!
After two relatively short months in the Stock Trends bear pit Boeing Co. (NYSE:BA) joyously returns to a ST Bullish trend. The Bullish Crossover (13-week moving average has moved above the 40-week moving average) makes BA a Stock Trends short-listed stock. BA's previous bull trend expired after an impressive 168-week run that commenced in the summer of 2003.
Things have picked up nicely again. Of Dow Industrial stocks, only Dupont (NYSE:DD) has performed better over the past three months. BA was a Stock Trends Pick of the Week selection on November 10 at $85.62, and remains a selection this week with its Bullish Crossover. The stock reached a high of $92.05 last week, but retreated a bit early this week. Today's close was $87.94.
Boeing's ST Report:
Thursday, October 19, 2006
Dow 12,000? Big Deal.
_27426_image001.gif)
The Dow Jones Industrial Index closed above 12,000 today for the first time. This achievement has been heralded by the financial media in the usual euphoric manner, delivering both excited investors eager to join in on the rally and fretting pessimists ready to bail before it implodes. But the 12,000 marker should be put into a proper monetary context, since the DJ Industrial is a price index. Adjusting the index for inflation reveals that today's close is 15% short of the inflation adjusted 2000 high.
Revealing for investors that do not consider the effects of inflation on the value of their equity assets is the comparison of compound rates of return for the Dow in nominal and real terms. In the post-WWII era the annual compound return on the DJI index is 7.3% (excluding dividends). The real compound rate of return is only 3.2%. Of course, real returns on the index should include dividends, but the effect of inflation on the value of the asset is not diminished. For the 19-year period since the days before Black Monday in 1987 the compound rate of return (nominal) of the index, inclusive of dividends, is an impressive 12%. But applying the CPI price deflator yields a 8.6% inflation adjusted return over this incredible bull market.
The advance of the stock market will always be a battle against alternative assets. And it will always be handicapped by monetary debasement. Investors should remember this important context when making judgments about the nominal price level of equity markets. Dow 12,000? Big deal.
The graph above shows the real (inflation adjusted) level of the DJ Industrial Index at 10-year October intervals over the past 60 years. This logarithmic representation misses the volatility of the index, most appreciably the highs of early 2000, but the trend of the real price level puts the advance of the U.S. stock market in a better context.
Tuesday, September 12, 2006
Telecom hits new highs
After testing its 40-week moving average during the summer months, Telecom HOLDRS (AMEX:TTH) is back on track. It's ralling point was almost two months ago when it surged from $29 to $31, but the current high is breaking as a resistance point. Consumer stocks in general are doing well, but a strong move by telecom stocks should be a very good sign. TTH closed today at $32.40, as its performance continues to best the market.
Thursday, September 07, 2006
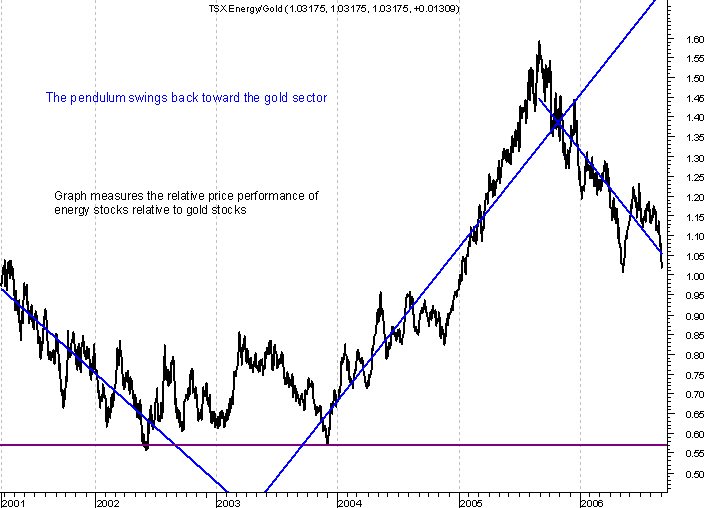
Gold stocks champion the market still
The performance of gold stocks in recent weeks shows us that investors have not abandoned their attachment to the commodity's bullish fate. Trading in Goldcorp (G) was again active, although the stock only advanced 1%. Goldcorp's courting of Glamis has been measured by the market, and the verdict is acceptable. Most importantly, the gold sector remains the market leader on the TSX, outperforming the broad market over the last 3-months by 11%. In the context of the ascendancy of this important commodity, it is again worthwhile to review the gold sector's relative performance to the equally important energy sector. Although both sectors are drivers of the TSX, they have a long-term pattern of inverse correlation. The graph above shows us that gold stock's relative performance has wrestled the lead from the formerly ascendant energy sector. This shift dates from about 52-weeks ago. The commodity currency for the two years prior to September 2005 was crude oil, but the pendulum has again shifted back to precious metals. Gold stocks are sparkling because it is their time to sparkle.
Tuesday, September 05, 2006
Rentcash breakout continues
Summer holidays over...back to the market!
After reporting stellar earnings for the fourth quarter, Rentcash Inc. shares (TSX:RCS) surged today by over 7%. RCS advanced 26% last week to the $7 level, bringing it to Stock Trends attention. The breakout coincided with the Bullish Crossover and triggered the stock's inclusion in last week's Picks of the Week report. RCS was also a Stock Trends Portfolio BUY last week at $7. Today's high was $7.80.
Wednesday, July 12, 2006
Bidding heats up on Canada Southern Petroleum
Sometimes corporate acquisitions are simple - a done deal at midnight. Sometimes the card playing moves on into the wee hours of the morning. Canada Southern Petroleum (TSX:CSW) seems to be holding the cards on its potential acquisition. The bidding for CSW has been raised to US$13 as PetroCanada (TSX:PCA) gets more aggressive in its interest in CSW. PCA's original May bid of US$7.50 has now been raised 73% thanks to active interest from Canadian Oil Sands Trust (TSX:COS.UN) and Canadian Superior Energy (TSX:SNG).
The original buyout offer triggered a Stock Trends Portfolio buy of CSW on June 8th at CDN $10.18. CSW trades 15% up today at CDN $15.17. Trading on the news sometimes pays off when the news just keeps coming. It's always nice to be wanted.... CSW shareholders are enjoying the popularity of the day.
Tuesday, July 11, 2006
Smucker jams it up
Some consumer staple stocks have picked up recently, and there is no better morning staple than jam. J.M. Smucker Co (NYSE:SJM) has rallied over the past few weeks as the market responds to strong financial results. Given the move to defensive stocks in some quarters, SJM's growing price momentum spells bread and butter for value investors. The changing trend situation has also made the stock a recent Stock Trends Pick of the Week.
Tuesday, June 13, 2006
Bullion ETFs vs. Gold stocks
For much of the early part of this year the iShares Comex Gold Trust ETF (TSX:IGT) under-performed the iShares S&P/TSX Gold Index ETF (TSX:XGD), but with the plummeting sector turning investor sentiment sour, investors in gold stocks and XGD are taking relatively more off the table. Measured by Stock Trends 13-week Relative Strength Indicator (RSI), the comparative price performance has now turned in IGT's favour.


Friday, June 02, 2006
Fortis utility
Rising volatility is factoring into sector moves. The Volatility Index (VIX) is now up over 25% in the last 13-weeks. Some investors may see this as a sign to move to defensive stocks. One TSX utility stock that is building price momentum is Fortis Inc. (TSX:FTS). It advanced 11% this week and has shifted to our Weak Bearish trend category. Current 13-week Stock Trends RSI is 108, ranking it highest among TSX utility stocks. Unusually high volume punctuated this week's move.
Friday, May 19, 2006
Broad correction on TSX
The TSX suffered considerably this week as the fear of a commodity blowout sent many investors to the exit. As a sample of this broad selling the Stock Trends distribution of Bullish stocks shifted considerably toward Weak Bullish. The S&P/TSX Composite, the big cap S&P/TSX 60 Index, as well as the S&P/TSX Midcap and Smallcap Indexes all lit up us Weak Bullish this week. Most telling of the breadth of the selloff is that 28% of trending stocks are now Weak Bullish. This is an important moment for the TSX as investors will look for a signal that the commodity cycle, while partially deflated, is still in swing.
Bulls & Bears graph
Thursday, May 11, 2006
May begins TSX symbol changes
Yes, the Toronto Stock Exchange has begun its about-face on the symbol extensions it introduced in 2004 - the ones that denoted specific subordinate, non-voting, restricted-voting, and multiple voting stocks. Stock Trends must endeavour to manage these changes again. The schedule for these symbol changes is published by the TSX at http://www.tsx.com/en/pdf/SymbolChangeList.pdf
Monday, May 08, 2006
BlackRock jackpot
It has been a long and joyful ride for BlackRock Ventures (TSX:BVI) shareholders, but today caps off the bullish trend with a cherry. Shell Canada has made an offer of $24 share for BVI, putting the buyout at $2.4-billion. The stock jumped on the news today and is now trading at $23.75, up 26% from Friday's close. Stock Trends followers will remember BVI's breakout in early 2005 as the stock was a Pick of the Week and a Stock Trends Portfolio buy on January 13, 2005 (at $8.80). That trade was stopped out at $9.22 on some volatility, but BVI has remained bullish through the stocks rallies and retreats. For those that stuck with BlackRock there is good reason to celebrate today.
Friday, May 05, 2006
Potash Corp turns bullish
Although Potash Corp. (TSX:POT) was playing with a trading range as it recovered from its bearish trend in the later half of 2005, the stock is showing signs of moving past resistance at $115. The secondary trend line for POT has moved above the long-term trend line, an event signalled by the Stock Trends Bullish Crossover. The newly Bullish stock is currently out-performing the S&P/TSX Composite by 9% over the last quarter and could be poised for a summer move.
Saturday, April 29, 2006
Exxon not that big in market's eye
For all the uproar from the ever corporate-bashing segment of the American leftist interest groups you would think Exxon was delivering more to the owners of this stock than it has lately. Yes, record profits continue for the company amid high crude oil prices and domestic refining bottlenecks...but investors holding XOM could hardly be making "outrageous" returns on Exxon in the first quarter of 2006. Indeed, the stock is basically performing on par with the S&P 500. The Stock Trends 13-week Relative Strength Indicator for XOM is 101. Big corporate profits are not enough sometimes. The scale may be there, but the market thinks XOM's potential is not atmospheric.
Wednesday, April 19, 2006
Corriente blasts past $7
Corriente Resources (TSX:CTQ) is a familiar stock to Stock Trends followers. It had its Bullish Crossover back in September 2005 and was a Stock Trends TSX Portfolio buy at $3.49. Although the CTQ holding was stopped-out at $4.92 in early March, the stock has remained bullish since. The last two weeks have been especially good as CTQ has rallied aggressively - the new listing on the AMEX has improved the company's visibility with U.S. investors. Today's 10 % gain pushes the stock into new rarefied territory. CTQ closed at $7.25.
http://www.stocktrends.ca/?symbol=CTQ-T&page=streport
http://www.stocktrends.ca/?symbol=CTQ-T&page=streport
Tuesday, April 18, 2006
Rite Aid
Consumer stocks are strong in a number of segments, and movement in pharmacy retailer Rite Aid (NYSE:RAD) is indicative of investor interest. RAD was particularly active last week, with 48.7-million shares trading in over 31,500 trades. The stocks current rally began in earnest in early March, with its move to $4. Trading at $4.30 today, this Stock Trends Weak Bearish stock is on our radar. It has been on the NYSE Picks of the Week report for the past two weeks.
Wednesday, April 12, 2006
Party like it's 1999
Maybe it was all too famously premature back at the turn of the millennium. Perhaps investors were giddy with the calendar as much as the emerging technologies that promised so much. The Internet bubble lives in ignominy, but six years later that promise if coming to steady fruition. Soon enough a world of content will be coming through the pipes and consumers are hungry for the culture and interaction being served up on the Internet. Disney's (NYSE:DS) announcement about Internet content delivery is part of a major shift in the way consumers will access their favourite programs. To borrow from the anthem of Prince, Internet stocks are "going to party like its 1999" all over again.
Evidence of the heated trading activity is found in the Internet Infrastructure HOLDRS (AMEX:IIH). Over the past month IIH has advanced aggressively on high volume. It ranks highly with a Stock Trends RSI of 121, and has made 52-week highs in each of the last four weeks. Last week IIH traded over 1500 times - far more than its usual level and twice as much as the previous week. Investors want a piece of the action and IIH is attracting those that want to play the industry. IIH was a Stock Trends Bullish Crossover at the end of December when it traded at $3.86. The issue trades at the $5 level now.
Monday, April 10, 2006
U.S. long-term rates recovering
The dire prospect of an inverted yield curve presaging a coming recession is a market concern. So a correction on the long end of the curve is a promising sign for stock market bulls. The easy money period has come to a close. The Fed's steady rise in the discount rate has helped correct a distorted debt market over the last few years, and it is time yields moved back to more normal levels.
Although the stock market has yet to come to terms with this, the movement of long-term rates is growth-positive. Currently, the 10-year Treasury Yield Index leads the U.S. indexes for market performance over the first quarter of 2006. Its Stock Trends RSI is 112, ahead of the Dow Jones Transports and the Russel 2000 - at 110 and 107 respectively. Notably, the price momentum of the 10-year Treasury Index is above the Short-term Interest Rate Index, confirming the correction away from the inverted yield curve scenario. Not surprisingly, interest rate sensitive utility stocks are suffering, as Dow Jones Utility Index ranks at the bottom of the U.S. Stock Trends RSI ranking. See:
http://www.stocktrends.ca/stonline/indexes/?indexgrp=U&weekdate=2006-04-07&order=rsi
Wednesday, April 05, 2006
China on my mind
No question: China is still hot with investors. The safe route for many is to buy country ETFs, and many are making their play on China's economic ascendancy by buying PowerShares Golden Dragon USX China E.T.F. (AMEX: PGJ). Last week 2.1-million shares traded as the ETF powered to a 52-week high. PGJ has kept up the bullish price move this week and is gaining more ground. The current price is $16.87.
Institutions feelin' good about the TSX
A good measure of the growing institutional interest in the iUnits S&P/TSX 60 Index exchange-traded-fund (TEX:XIU) is the weekly average traded value Stock Trends calculates. Last week was an especially important week as trading volume for XIU was exceptionally high - Relative Volume hit 11% and over $929-million of shares traded. Much of this activity was institutional. Average traded value of XIU last week approached $350,000 - much higher than its normal level. Today's activity takes XIU ever closer to $70, spurred on by general bullishness about the resource-heavy TSX. Investors - big and small - are betting that XIU has plenty of leg left in its bullish trend.
Tuesday, April 04, 2006
Domtar blossoms
Although today was a bit of a downer, several forestry stocks are pulling out of their winter blues. Most fetching is Tembec (TSX:TBC) and Domtar (TSX:DTC). Both stocks are currently rallying out of long-term bearish trends and have been highlighted as Stock Trends Weak Bearish stocks for several weeks. Domtar outperformed the S&P/TSX Composite by 11% in the first quarter, but much of the gains have come in the last month. Today's weakness may be a good opportunity to pick up DTC, as the stock fell with the market.
http://www.stocktrends.ca/?page=streport&symbol=DTC-T
http://www.stocktrends.ca/?page=streport&symbol=DTC-T
Tuesday, March 28, 2006
TSX Bullish sentiment firm
The Bull/Bear ratio on the Toronto Stock Exchange has reached 2.04, with 55% of trending stocks currently labelled as Stock Trends Strong Bullish. Nevertheless, the past two years the peaks of bullish sentiment were reached in the March. The coming months may present some cautious spring winds.
Friday, March 24, 2006
Steel stocks press on
Trading activity in Algoma Steel (TSX:AGA) was high this past week. Steel stocks continue to press north, with AGA out-performing the market by 32% over the past quarter. Industry consolidation factors into the market's buying pressure. Certainly, IPSCO Inc's (TSX:IPS) has set an impressive standard: it leads the S&P/TSX 60 stocks in 2006 performance and continues to reach new highs. Nevertheless, AGA traded much more actively this week in terms of Relative Volume and the Stock Trends Unusual Volume alert makes the stock especially interesting. Current price is $32.49.
Thursday, March 23, 2006
Smith & Wesson shoots first
The past year has been a ride for Smith & Wesson Holding Corp (AMEX: SWB), but investors are starting to holster-up in the stock again. The stock hit a high of $6.22 today - not too far off its peak of $6.96 a year ago...before it misfired. SWB has rallied nicely in 2006. Its Stock Trends RSI has climbed to 147, and the stock has been a Stock Trends Pick of the Week for the past two weeks.
Marginal utilities
The poorest performing TSX sector in the first quarter of 2006 has been the utilities. The 13-week Stock Trends RSI for the S&P/TSX Utilities Index is 86. This sub-market performance relates significantly to the rising interest rate environment. Indicative of the weakness is the performance of TransAlta (TA-T), Fortis (FTS-T), and Canadian Utilities (CU.NV-T).
http://www.stocktrends.ca/?page=streport&symbol=TA-T
http://www.stocktrends.ca/?page=streport&symbol=CU.NV-T
http://www.stocktrends.ca/?page=streport&symbol=TA-T
http://www.stocktrends.ca/?page=streport&symbol=CU.NV-T
More Hanfeng with your rice?
Hangfeng Evergreen (HF-T) rallies above $4 today on strong volume. HF has been advancing over the past few weeks. Today's material news:
TORONTO, March 23 /CNW/ - Hanfeng Evergreen Inc. ("Hanfeng" or the "Company") has entered into a Letter of Intent with the China National Hybrid Rice R&D Center (the "Center") for a program of field trials and marketing of Hanfeng's Sulfur Coated Urea (SCU) slow-release fertilizer in China's main rice growing regions. The field testing will focus on measuring and recording the effectiveness of SCU to increase rice crop yield and quality. This ground- breaking cooperation is headed by world-renowned scientist, Dr. Yuan Longping, Director of the Center, and revered throughout the developing world as the "Father of Hybrid Rice".
HF has been a Stock Trends TSX Portfolio holding since January 26.
Wednesday, March 22, 2006
Increased volume for SunOpta
SunOpta Inc (SOY-T) has been a Stock Trends TSX Portfolio holding since January 19, but this week marks an important elevation of interest in this stock. Yesterday the company's chairman presided over the opening bell at the NASDAQ, celebrating its February listing on the exchange. The additional profile helped stir trading in the stock as it climbed to a high of $9.66 on the TSX (US$8.30 on NASDAQ where it trades as STKL-Q).
Tuesday, March 21, 2006
Clean Air popular, but off highs
A top performing U.S. exchange traded fund is Powershares Wilderhill Clean Energy Portfolio - PWB (http://www.powershares.com/pbwfund.asp ), which has outperformed the S&P 500 by 18% over the past 13-weeks. PWB stock holdings include Zoltek Cos (ZOLT), Evergreen Solar (ESLR), Suntech Power Holdings (STP), MEMC Electronic Materials (WFR), Ballard Power Systems (BLDP), and Ormat Technologies (ORA). PWB has fallen off its 52-week high ($21.13) in recent weeks and closed today at $19.75.
Canadian small caps gushing
The top performing Canadian index this year has been The S&P/TSX Venture Composite Index. It has a 13-week Stock Trends Relative Strength Indicator (RSI) of 113 - telling us that it has out-performed the senior TSX by 13%. The NASDAQ Canada Index, also indicative of Canadian small cap performance, is runner-up with an RSI of 109.
Favrille treatment
After scaling to a 52-week high last week, bio-pharmeceutical stock FVRL closed at $6.63. Recent insider buying is of note (2.1-million shares), but volume in Favrille Inc's stock picked up considerably last week. The stock is back near its high today, trading at $7.50 at midday.
Tuesday, March 14, 2006
Bullish sentiment still in place
Stock Trends barometer of investor sentiment remains bullish. Although the general tone of the marketplace seems tentative, with analysts split on the prognosis for stocks in 2006, the current trend situation is favourable. The Stock Trends Bull/Bear Ratio measures the aggregate distribution of stocks with Stock Trend indicators. These indicators switch between Bullish and Bearish when the secondary trend line and the primary trend line of individual stocks (and indices) intersect. A Bullish stock has its 13-week average price above its 40-week average price. Conversely, a Bearish stock has its 13-week average price below its 40-week average price. More recent price movement dictates the trend indicator.
Currently, the Stock Trends Bull/Bear Ratio for North American markets remains strong:
Bull/Bear Ratio
TSX 1.84
NYSE 1.50
AMEX 1.83
NASDAQ 1.59
See: http://www.stocktrends.ca/?page=stbvb&x=T
Currently, the Stock Trends Bull/Bear Ratio for North American markets remains strong:
Bull/Bear Ratio
TSX 1.84
NYSE 1.50
AMEX 1.83
NASDAQ 1.59
See: http://www.stocktrends.ca/?page=stbvb&x=T
Monday, March 13, 2006
Nucor
The top performing Dow Jones industry group in 2006 is... steel! And despite the fact that most of the group did poorly this past week, Nucor Group (NUE) hit another 52-week high, closing up 8.3% at $95.08. However, today's open above $96 was followed by profit-taking as the stock dropped by $3 in afternoon trading. Keep an eye on trading in the steel group as a top forms for many of these high flying industrial stocks.
Boeing cruises
Also hitting a 52-week high, BA remains stuck under the $75 level. The stock has developed resistance here, so a move above $75 would be telling. BA is in week 141 of its bullish trend, and has the longest bull trend of all the Dow Jones Industrial stocks. This week's Barron's cover story detailing Boeing's turnaround and resurgence over the last five years paints a positive picture for Boeing and its battle with Airbus. Look for the BA bullish trend to continue.
Proctor & Gamble continues to clean up
Hitting a new 52-week high this week, PG has performed well since its Bullish Crossover on September 9. The stock has advanced 9.4% as the bullish trend has developed. This consumer stock is out-performing the S&P 500 by 7% over the last 13-weeks.
General Motors
The top performing Dow Jones Industrial stock this past week was GM - up 12.6%. Although GM is a Newly Weak Bearish stock, this price advance is not sufficient enough to stem the current bearish sentiment. This stock has much work to do before the market will give its blessing.
Kodak moment
Another consumer stock that has had a long stay on the Bear train, Eastman Kodak, has elevated itself into Stock Trends Pick of the Week report. About a year ago EK peaked at the $35 level and then lost investor support as it plunged. Hitting bottom in October at nearly $20, EK has fought back from concerns it is not up to the challenges of the digital era. Its intermediate trend has been developing in the early months of 2006, and EK is a Bullish Crossover and Pick of the Week currently.
Consumers stocks stand to attention
A host of other consumer stocks are lighting up our trend alert filters. The Picks of the Week report includes the like of Federated Department Stores (FD), Del Monte (DLM), HJ Heinz (HNZ), Estee Lauder (EL), Constellation Brands (STZ), and Verizon Communications (VZ). So perhaps investors are not taking such a negative view of the prospects for the U.S. consumer.
Krispy Kreme warming up
Closing at $7.95 on Friday, up $1.38 on the week, KKD traded heavy volume following the announcement that a former Kraft Foods executive will take the helm at troubled Krispy Kreme. KKD has been steadily recovering from 4th quarter lows (late October, $3.91), and has been a Weak Bearish stock most of the last three months. Nevertheless, Krispe Kreme is on a short leash with the NYSE, and must comply with its required filings as its listing extension deadline (April 30) draws near. The market seems to think a new master will put things in order. KKD was nearly a $50 stock three years ago, but if investors can put that history behind and look at the possible trend change at work, the opportunity for trading profit comes - at some level of risk. A Bullish Crossover is predicted for the coming week, this coinciding with the closure - perhaps - the new CEO hopes to usher in.
Wednesday, March 08, 2006
Hanfeng is fertile
One of the current Stock Trends TSX Portfolio holdings, Hanfeng Evergreen (HF), advanced over 9% today after very positive earnings were announced. The stock closed at its high of $3.55 today. The Stock Trends Portfolio picked up HF in late January.
Monday, March 06, 2006
Human Genome Sciences (HGSI) recovery
Human Genome Sciences (HGSI) has rallied from its fourth quarter '05 lows of $7.63 and is now trading near $14. Currently a Stock Trends Weak Bearish stock, HGSI has developed a strong enough intermediate trend to be on our stock watch. If it moves through resistance at $14, expect price momentum to carry the stock higher yet.
Heavy machinery moves
The best performing stock in the Dow Jones Industrial Index is Caterpillar (CAT). It has out-performed the broad market by 25% in the past quarter. But other heavy machinery stocks are moving, too. Last week was positive for these bullish stocks: CAT up 2.6%, JLG Industries (JLG) up 7.1%, and CNH Global (CNH) up 5.1%. Deere & Co. (DE) is trading very near its 52-week high, as well. The best performers over the past 13-weeks are Manitowoc (MTW) which is up 48% in the past 13-weeks, and CNH up 50% over the period. CNH has been a Stock Trends Pick of the Week for the past three weeks and is currently a Bullish Crossover stock.
Zarlink Semiconductor hits new high
Over 4.8 million shares of Zarlink Semiconductor (ZL) traded today - the stock moving above resistance at $2.80 as it reached a new high of $2.88. ZL has been on a bullish trend since last autumn, currently a Stock Trends Bullish stock with an 13-week RSI of 123. Today's positive move signals a continuation of the trend.
http://www.stocktrends.ca/?page=streport&symbol=ZL-T
http://www.stocktrends.ca/?page=streport&symbol=ZL-T
Friday, March 03, 2006
ShawCor pick
Energy services stocks are hot again. ShawCor Ltd. (SCL.SV.A) is one of the Stock Trends Picks of the Week as it has rallied strongly off of its lows in late 2005. This changing trend makes SCL.SV.A a Stock Trends Weak Bearish stock. The Relative Strength Indicator is now 112, and will be improving should today's positive move above resistance at $18.50 hold. Volume has been strong, so look for continued price momentum and a new bullish trend.
http://www.stocktrends.ca/?page=streport&symbol=SCL.SV.A-T
http://www.stocktrends.ca/?page=streport&symbol=SCL.SV.A-T
Golden Star Resources advances on low volume
Golden Star Resources (GSC) advanced 5.3% last week on low volume. GSC has a Stock Trends Weak Bearish trend, with a Bullish Crossover anticipated this coming week. While low trading volume is normally a cause for concern with bullish trending stocks, it can signal an important shift in bullish sentiment for stocks in bearish trends that are advancing off support levels. The stock is up again today, currently trading at $3.88.
Thursday, March 02, 2006
CIBC tests resistance
CIBC (CM) has failed to gain much traction since its rally off of its lows back in the autumn. It has tested resistance at the $81 level earlier in the year, but the move today to a new 52-week high at $81.75 offers traders another cue. Should CM move significantly through this level the prospects for its bullish trend would improve.
Canaccord's graduating performance
Financial stocks have done well recently. Many of the big banks are making 52-week highs on the TSX, but a relative new-comer to the TSX stage is steadily gaining an audience of investors. Canaccord Capital (CCI) is a major independent Canadian retail brokerage house, and its stock has been on a solid bullish trend since last September. Currently trading at $17.50, CCI has advanced 61% since its Stock Trends Bullish Crossover signal. It was a Pick of the Week on August 25 at $10.70. Although the stock is off its 52-week high ($18.95), CCI is outpacing the Toronto market by 12% in the past 13-weeks. Perhaps ahead: inclusion in the S&P/TSX Composite Index?
http://www.stocktrends.ca/?symbol=CCI-T&page=streport
http://www.stocktrends.ca/?symbol=CCI-T&page=streport
Sunday, February 26, 2006
AMEX moves
The American Stock Exchange Composite Index (AMEX) is out-performing the S&P/500 Composite Index by 6% over the past 3-months. It advanced another 1% this past week thanks to activity in some of the the exchange's precious metal stocks. But the AMEX is also home to many of the Exchange Traded Funds (ETF) that investors are increasingly trading. Leading the AMEX ETF's this week was the iShares S&P/TOPIX Index Fund (ITF), which is a basket of Japanese stocks. ITF advanced 3.4% and has a Stock Trends Bullish indicator with an RSI of 109.
Disney trend turns bullish
The intermediate trend line of Walt Disney Corp (DIS) has moved above the primary long term trend line, signalling a Stock Trends bullish trend. DIS has advanced 22% since the October low, closing on Friday at $27.98. The stock is out-performing the S&P 500 by 10% over the past 13-weeks. February's advance has been especially strong. This week's Stock Trends Bullish Crossover signals a good entry point for long-term investors, regardless of the rally's current maturity.
Friday, February 24, 2006
Western Silver bonanza
No sooner does Glamis Gold (GLG) enter the honoured ranks of the S&P/TSX 60 index, then it stirs up the mix for all those portfolio managers who have to pick up the stock for their funds. Today's announced $1.2-billion buyout offer for Western Silver (WTC) adds some spice. Glamis means to go big, and the market will have to digest this quickly. GLG is off 4% post-announcement today.
But for WTC shareholders the buyout offers a nice premium. WTC was a Stock Trends Pick of the Week in early December when it traded at $12.02, and it had a Bullish Crossover on December 22. Today's big pop to $24.61 reminds us that consolidation is going to be a factor in the sector.
http://www.stocktrends.ca/?page=streport&symbol=WTC-T
Real Estate advances
The top performing stocks in the S&P/TSX Real Estate Index continue to move forward. Real estate stocks are up 2.5% this past week. Leading the group is Boardwalk Real Estate Investment Trust (BEI.UN) which is at a 52-week high today. It is outperforming the TSX by 8% over the last 13-weeks. Canadian Real Estate Investment Trust (REF.UN) advanced 6.6% last week. The relative performance of the sector is reflected by the fact that the iUnits S&P/TSX Real Estate Index ETF (XRE) has had positive moves for 6 of the 8 trading weeks to-date in 2006.
Tuesday, February 21, 2006
Telecom calls
The big telecom stocks have moved well over the past month or so. AT&T (T), Verizon (VZ), BellSouth (BLS), and Sprint Nextel (S) have been garnering price momentum. All had good moves last week. The Telecom Holdrs (TTH) exchange traded fund is good basket to trade this group. It is at a 52-week high after advancing 4.6% last week.
Monday, February 20, 2006
Fedex back near 52-week high
Fedex Corp. (FDX) was the best performing stock in the DJ Transport index this past week. Closing just below its 52-week high, FDX advanced amid the drop in crude oil prices and an announced quarterly dividend.
http://www.stocktrends.ca/?symbol=FDX-N&page=streport
Eastman Kodak develops trend
The digital age has been tough on Eastman Kodak, and it's stock has suffered for it. EK has been a Bearish stock for 41-weeks, but the current price momentum has taken it back to a level that alerts us of a change in trend. Perhaps investors have decided not to write EK off yet. Let's see how this intermediate trend develops.
http://www.stocktrends.ca/?page=streport&symbol=EK-N
Loosing weight - WTW
Spurred by positive news on the earnings and dividend front, trading in Weight Watchers International (WTW) was heavy. The stock advanced 11.6%, closing at $52.79, and became a Weak Bearish stock. However, expect some resistance at this level - losing market weight isn't easy.
Thursday, February 16, 2006
Time to Google "Sell"
Despite the positive move this morning, Google (GOOG) is in the Stock Trends dog house. The stock originally turned Weak Bullish on January 20, although it bounced back the following week enough to turn briefly back to our Bullish category. It is now in the Weak Bullish category and the share price is approaching the 40-week moving average. Clearly, the Google bears are coming out, and the magical ride this stock has enjoyed since its original listing has come to an end. It is time to bail...or buy. Buyers are doing so at high risk, as articles like the one in Barron's on the weekend point out. For trend-following traders, though, the picture is clear: it's time to sell.
Friday, February 10, 2006
Media stock revives
Thomson Corp (TOC) closed in positive territory today, despite a rough morning. TOC is a Newly Weak Bearish stock thanks to a solid performance last week - up 4.8%. Look for the stock to build price momentum in coming sessions.
http://www.stocktrends.ca/?page=streport&symbol=TOC-T
http://www.stocktrends.ca/?page=streport&symbol=TOC-T
Thursday, February 09, 2006
A best buy
Amid the weakness in high-flyin' gold and energy stocks, some consumer stocks have stood their ground. Today's trading in Best Buy (BBY-N) reminds us that the underlying economy is still strong. Strong volume and an 8% advance in share price is always worth noting, but this strong bullish stock is also testing resistance at its 52-week high. Watch for movement past $53.
Friday, February 03, 2006
Shaw Communications continues rally
Shaw Communications (SJR.NV.B) advanced 5% on heavy volume last week, continuing its $5 rally from its autumn lows. SJR.NV.B is one of Stock Trends Bullish Crossover stocks this week, as the 13-week moving average has penetrated above the 40-week moving average - our indicator that the long-term trend is now bullish. Shaw is outperforming its peers, with a 13-week Relative Strength Indicator of 106. Rogers Communications (RCI.NV.B), by comparison, has an RSI of 94. Although Rogers has been in a bullish trend for 68-weeks, Shaw is now righting its ship and setting the sails.
http://www.stocktrends.ca/?symbol=SJR.NV.B&page=streport
Heavy trading on TSX
As the S&P/TSX Composite Index flirts with 12,000, investors are trading at a frenzied pace. In the past 5 trading days over 2-billion shares have exchanged hands. This is a level unseen yet - even in the frothy days of 2000. Over 1.8-million transactions were logged in, so the Canadian investor is hungry for more profits.
The current Stock Trends TSX Bull/Bear ratio is 1.4, with 54% of trending stocks labelled as strong bullish.
Wednesday, February 01, 2006
Altera tests resistance at $20
The Philadelphia Semiconductor sector (SOXX) index has been strong the past two months, with last week's 7.4% gain reminding us that semiconductor industry is a hot place to be. Today was another positive move for the SOXX, with all but two in positive territory. Big movers last week like Broadcom Corp (BRCM) and Marvell Technology (MRVL) joined Advanced Micro Devices (AMD) as stellar performers in the group. But the best performer today was Altera Corp (ALTR), with a 4.3% gain closing at $20.13. ALTR has a Weak Bearish Stock Trends indicator and a strong RSI (110), so it is a stock we can focus on. The resistance level at $20 is established, so a solid move above $20 would be a very positive sign. The sector strength will help ALTR move through this resistance.
Tuesday, January 31, 2006
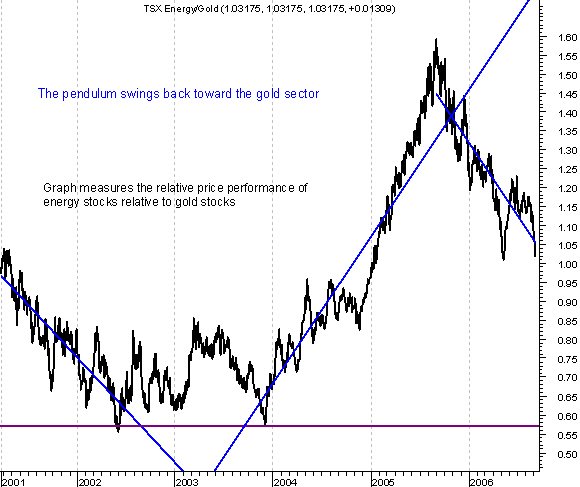
Gold stocks unstoppable

When will this end? Gold was up again today, closing at $570, and gold stocks advanced another 2% on the TSX. The heaviest trading was in Bema (BGO), Kinross (K), and Eldorado (ELD). The S&P /TSX Gold Index has been a Stock Trends bullish sector for 22 weeks, but really began its bull rally in mid-May of last year. Certainly, gold prices of plus-$500 were ambitious targets at that time. As to the near future: bet on further advances as gold - and gold stocks - catch up to the strong move in oil prices in the last couple of years. The ratio of oil to gold is a commonly watched relationship, and this pendulum has begun to swing back toward gold. The graph shows the relationship between energy stock prices (S&P/TSX Energy Index) and gold stock prices (S&P/TSX Gold Index). In the past two years the trend has been toward the energy sector. However, the relative strength of the gold sector is starting to show. The Energy/Gold ratio is dropping, reflecting greater price appreciation in gold stocks relative to energy stocks. Gold is again winning back favour as a commodity currency. The current Stock Trends RSI for Gold stocks is 118, compared to Energy stocks at 108 (see http://www.stocktrends.ca/stonline/indexes/?indexgrp=C&weekdate=2006-01-26&order=rsi). The market is looking for more.
Sunday, January 29, 2006
Top performing U.S. indexes
The ranking of the best performing U.S. indexes over the past 13-weeks tells us a lot about the character of the U.S. market. At the top, outperforming the S&P 500 by almost 30% is the Gold & Silver Mining index - not surprising considering how hot this sector has been. Out-performing the market by 21% is the Philadelphia Semiconductor index, the SOXX, which had a stellar week advancing 7.4%. Next in line is the DJ Transport index, which has been advancing strongly thanks to the railroad stocks.
Traders and small investors already know this: small cap stocks are big! They are outperforming the S&P 500 by 8%, as the Russell 2000 and Wilshire small cap index show.
For a weekly ranking of the performance of U.S. indexes go to:
Saturday, January 28, 2006
Bullish sentiment improves
There are 60 new Bullish Crossover stocks on the NYSE this week, helping to bring the percentage of strong bullish stocks to 47.5%. The number of Weak Bearish stocks increased to 15.3%, so the bullish sentiment will continue to improve.
The percentage of strong Bullish stocks on the NASDAQ is now 50%, with the Bull?Bear ratio at 1.4. The AMEX has 51% of trending stocks currently labelled as strong Bullish.
To see the current distribution of the Stock Trends trend indicators, go to:
http://www.stocktrends.ca/?page=stbvb&x=N
The percentage of strong Bullish stocks on the NASDAQ is now 50%, with the Bull?Bear ratio at 1.4. The AMEX has 51% of trending stocks currently labelled as strong Bullish.
To see the current distribution of the Stock Trends trend indicators, go to:
http://www.stocktrends.ca/?page=stbvb&x=N
Friday, January 27, 2006
Corriente Resources advances
One of the Stock Trends Portfolio holdings sparkled today, closing at $5.25 with a 9.4% gain. Corriente Resources (CTQ-T) entered the ST TSX Portfolio in early September at $3.49. Currently the portfolio is predominantly invested in gold and mining stocks.
Wednesday, January 25, 2006
Plantronics has a big growth spurt
A Stock Trends Weak Bearish stock since January 6, Plantronics Inc (PLT) surged over 17% today on the NYSE. Reaching a high of $37, PLT has traded 3-million shares already today. The Weak Bearish indicator is our long-term trend alert that the current bearish trend is changing. Today's move advances that prospect.
Tuesday, January 24, 2006
More bulls to come...
The number of Weak Bearish stocks on the TSX measures 20% of the total trending stocks. This is a high level, and is generally an indicator that there will be an expansion in the number of bullish stocks over the next period. Indeed the number of Weak Bullish stocks (an indicator of fading bullish sentiment) is down to 2%. Currently 50% of TSX stocks are Strong Bullish. We can expect this number to rise in the coming weeks.
The NYSE is also showing strong bullish sentiment. Strong Bullish stocks account for 45% of the total, while Weak Bearish stocks number a relatively high 12%. This also bodes well for the coming period. For a look at the current distribution of the Stock Trends indicators on the NYSE, check the Bulls and Bears graph at the following link:
Steel stocks surge
Trading in a number of steel stocks fueled strong gains today. Steel stocks have been fairing well this year, ranking #12 in industry year-to-date performance as of last Friday. Today's performance will improve that ranking. Topping the group today is A K Steel (AKS) with a 28% gain on the NYSE. U.S. Steel (X) jumped 8% to close at $55.74. In all, 11 steel stocks advanced at least 4% today on the Big Board. Look for continued price momentum in this hot group.
McAfee drops
There is heavy trading in McAfee Inc. (MFE) on the big board today as this Stock Trends Bearish Crossover stock slides even more. The Bearish Crossover last week was an exit signal not normally ignored, and the drop to $23 takes the stock into unsupported territory.
Monday, January 23, 2006
Canadian Natural Resources full to the brim...again
It has only been eight months since Canadian Natural Resources (CNQ) last split its stock, but here we are again - back where we started. That would be a 100% gain since May of last year. Impressive. CNQ closed just shy of $70 on the TSX and at $60 on the NYSE. Not coincidentally, CNQ split its stock in May of 2004 at the same levels. It would not be too much of a stretch to expect another split in the coming months.
Stock Trends helped identify a trading opportunity most recently in CNQ when the stock was tagged as Weak Bullish back in October. The share price had drifted back toward a support level and the Weak Bullish indicator alerted to this trend violation. The stock has rallied since - up 55% since the October bounce.
CNQ is week 150 of a Stock Trends Bullish trend - a three year performance that is quite remarkable - especially because the end does not seem near. This is a winning horse...with legs!
Saskatchewan Wheat Pool advances on heavy volume
A Stock Trends Pick of the Week stock for the past two weeks, Saskatchewan Wheat Pool (SWP) continues to rally on strong volume. A Bullish Crossover stock, SWP has been on a steady upward march since November. SWP has traded over 2-million shares today and hit a new high since the stock's big drop last spring. SWP shares trading today at $7.80, representing a 17% year-to-date performance.
http://www.stocktrends.ca/?page=streport&symbol=SWP-T
Saturday, January 21, 2006
Railroad stocks roll
The market finished on a bad note this week. The Dow Jones Industrial Index closed down 2.7% on the week, with only 3 of the 30 index members advancing. Hitting a 52-week high, McDonalds (MCD) with its 4% move was the best performer of the Dow 30. But the major tremor was felt in the technology sector. Internet, and semiconductor stocks took the biggest hit - poster boys IBM (down 2.1%) and Intel (INTC) (down 15.6%) both responding to investor jitters - while Yahoo (YHOO)(-15%) and Google (GOOG)(-14%) were meted a serious flight of sellers on the NASDAQ. Financial stocks also dropped 3.3%, with insurance stocks like AIG and Metlife (MET) notably weak. Stock Trends followers will find multiple bank stocks in our listing of Newly Weak Bullish stocks - including Bank of America (BAC), Citigroup (CIT), Wachovia (WB), US Bancorp (USB), and Commerce Bancorp (CBH). Indeed, the coming week will present some important answers about the resiliency of both the technology and financial sectors.
Amid the scampering of little feet toward the exits there was also a solid party of investors who would have none of the panic, instead nestling even closer to the bar with their cigars and cognac. These hardcore investors were definitely old school - picking up rolling stock, of all things. Railroad stocks rose a healthy 4%, outperformed this week by only the oil services industry. Union Pacific (UNP) (up 6.4%), and Norfolk Southern (NSC) (up 4.2%), and Burlington Northern Santa Fe (BNI) (up 2.7%) were the most actively traded of the group. The railroads have been one of the best performing industry groups in the past year - currently up 37% from a year ago. The strong bullish trend in these transport stocks seems to be an important antidote to the market's queasy feelings.
http://www.stocktrends.ca/?symbol=UNP-N&page=streport
Friday, January 20, 2006
Transalta (TA-T) breaks below support
One of the stocks that is a Stock Trends Newly Weak Bullish is TransAlta Corp. (TA-T), signalling a break in the bullish trend and as the share price has fallen through support. The Stock Trends indicator alerts toward monitoring this stock. Further price erosion would be a sell signal, while bullish holders of TA may look for price recovery and accumulate of the current weakness.
Thursday, January 19, 2006
Phazar (ANTP) surges
Another stock highlighted in our Newly Weak Bearish report continues to advance aggressively. Phazar Corp. (ANTP-Q) hit a high of $22.18 today. ANTP moved joined Stock Trends watch list after its big move last week. The current trading level is well above the 40-week moving average.
Wednesday, January 18, 2006
Crystallex (KRY-T) advances again
Crystallex International Corp (KRY-T) has been on Stock Trends watch list since the beginning of December. Trading today continues to push the stock higher, reaching a high of $3.39 on the TSX this morning. KRY was also a Low Volume Gains stock in the December 22 Stock Trends report - sometimes an indicator of interest for Weak Bearish stocks, as it can signal a pending breakout.
Ivanhoe!
Ivanhoe Energy (IE-T) has advanced to a high of $3.49 on the TSX today - an impressive move. IE was one of the highlighted stocks in Stock Trends Newly Weak Bearish report last week. Stock Trends Weak Bearish category is an early indicator of a change in a bearish long-term trend. Last week IE was also tagged with an unusually high volume indicator - another good sign.
Monday, January 16, 2006
BMO continues to climb
The best performing bank on the TSX has been Bank of Montreal (BMO-T), with a current RSI of 108. By comparison, of the other TSX-listed banks only Laurentian (LB-T) has out-performed the broad market in the past 13-weeks. BMO closed today at $70.24 - another 52-week high.
The Goldcorp standard
Goldcorp (G-T) hit $30 today, a welcome event for Stock Trends followers who bought this Pick of the Week stock back at the end of June for $19. Precious metals figured prominently in our weekly Picks during that time, and continue to populate the Stock Trends Portfolio.
For a history of Goldcorp's Stock Trends indicators see:
Sunday, January 15, 2006
Take a seat on the La Z Boy (LZB)
Consumer product stocks have been showing up in our filters recently. Some home furnishing stocks have done well enough to outperform the market handsomely. Home Furniture Brands International (FBN-N) was a Bullish Crossover stock a week ago, and now sports an RSI of 129. A pause in its third quarter rally has held FBN back in recent weeks, but a move to $24 bodes well for further advances. Similarly, La Z Boy (LZB-N) has resistance to break through at $15.30. Watch these stocks move from the comfort of your living room.
Is Merck back?
Merck (MRK-N) has been a Stock Trends Weak Bearish stock for most of the past 11 weeks, and should be a Bullish Crossover stock in the coming week. The price momentum is relatively strong, with Merck out-performing the S&P 500 by 14% in the past quarter. Other big Pharma stocks cannot boast this performance.
Pull up your SOXX
Behind only the Gold and Silver Index, the Semiconductor Index (SOXX) has set the pace in the past 13-weeks. The SOXX is outperforming the S&P 500 by 10% and is showing just how hot semiconductor stocks are. Leading the pack is Advanced Micro (AMD-N) and Zarlink (ZL-N). ZL is up 10% this week on unusually high volume.
Saturday, January 14, 2006
Top performing U.S. traded ETF
The gold bugs have found many opportunities for trading profits, but did you know that the top performing AMEX-traded ETF over the past 13-weeks is the Ishares MSCI South Africa (EZA)? This ETF is out-performing the S&P 500 by over 20%.
http://www.stocktrends.ca/?page=streport&symbol=EZA-A
Check out Stock Trends complete ETF ranking at:
http://www.stocktrends.ca/?page=stonline_filters&exchange=A
Trading activity in International Equity ETF (XIN-T)
Although the positive move in iUnit International Equity ETF (XIN-T) underperformed the TSX market, unusually high volume this past week suggests some investors are anxious to particiapte in bullish international markets. The number of transactions in XIN was much higher than the weekly average this past week. Stock Trends' high volume indicator also shows heated action in this trade. The new year has shown a heightened level of investor confidence.
Stock Trends TSX Portfolio results
Current stock holdings in the Stock Trends TSX Portfolio are performing well in recent weeks. The portfolio is up 9.4% YTD, thanks to its gold stock weighting. A broadening of the bullish market sentiment will mean new stock holdings in the coming weeks. There was a new Buy this week.
You can check out the 12 year trading history of the Stock Trends TSX Portfolio at:
http://www.stocktrends.ca/?page=stport
Friday, January 13, 2006
TSX Bull/Bear Ratio improves
The Stock Trends sentiment indicator has improved from its neutral position to 1.10, indicating that market breadth is becoming more favourable. Strong bullish stocks account for 48% of total TSX trending stocks. The rise in the number of weak bearish stocks also indicates an improvement in the sentiment indicator.
See http://www.stocktrends.ca/?page=stbvb
See http://www.stocktrends.ca/?page=stbvb
More precious metal plays
The beginning of 2006 will be set in a speculative fashion, as traders stick to the hot gold and energy sectors. Many of these stocks are leading our momentum category, with strong bullish trends. Although the best performing sector this week was Health Care, the number of stocks reaching new highs in the precious metals industry is substantial.
Looking for a stock that may have some upside potential in this mix? One of the Stock Trends Bullish Crossover stocks this week looks promising. It's chart is exhibiting a trend reversal, rising price momentum and strong volume.
http://www.stocktrends.ca/?page=stonline_filters&exchange=T
Subscribe to:
Comments (Atom)