Friday, February 09, 2007
Toromont Industries advances
Stock Trends Report - TSX:TIH
http://www.stocktrends.ca/?page=streport&symbol=TIH-T
Wednesday, February 07, 2007
Stock Trends TSX Portfolio trading results
The ST Portfolio equity line (see below) shows the path to its current level. In the 690 weeks since inception there have been 393 positions taken to date. The number of winning trades (159) gives this mechanical trading strategy a 40% success rate on individual trades. This may seem low to inexperienced investors, but many successful traders have winning percentages below 50%. Indeed, professional traders expect losses – they are a part of the business of trading. Generally, traders manage to succeed against these odds because they limit position losses and let profits run.
Stock Trends TSX Portfolio Trading Statistics
- Total Gain $240,912 (577%)
- # of weeks 690
- Total # of trades 393
- Winning Trades 159
- Losing Trades 234
- Winning % 40%
- Average # of weeks each position held 7.3
- Average # of positions held each week 4.2
- Average Gain $3,028 (30%)
- Average Loss $1,028 (-10%)
- Average Investment $41,737
- Average trade $10,000
- Maximum Drawdown (%) -34.2
- Largest Gain $40,880 (409%)
- Largest Loss $3,542 (-35%)
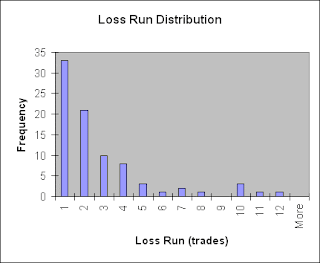
- Maximum losing trades in Succession 12
- Standard Deviation 7.7%
- Ulcer Index 9.8
- Profit factor 2.00
- Pessimistic Return Ratio 1.97

The Stock Trends Portfolio gives an example of this relationship. The average return on winning trades is 30%, while the average loss is 10%. Although there is some variability in returns – the standard deviation is 7.7% - the sporadic achievement of some hyper-return trades generates the desired positive result. The skewed distribution of returns shows a clustering two standard deviations around breakeven. The vast majority of trades cancel each other out, leaving the portfolio returns determined by the balance of high return trades versus the limited losses of the losing trades. Traders will recognize this pattern: managing losses of frequent infield hits in between scoring periodic “home runs”. Some of highly profitable trades are documented in the Stock Trends TSX Portfolio trading history found at ( http://www.stocktrends.ca/stonline/stp-tsx1.php ).
An important consideration for traders is drawdown, or the drain on equity that invariably comes when trading goes sour. Indeed, even with an exceptional winning percentage of 75% there is a 10% probability that a trader will experience a loss run of 5 (See Van K. Tharp’s article on randomness and streaks at http://www.iitm.com/Weekly_update/Weekly_241_oct_12_2005.htm ).
That means that even the most prescient stockpicker will face drawdowns. The Stock Trends TSX Portfolio trading record shows the longest loss run (Jan 1997 to May 1997) was 12 trades but only resulted in a 4% drawdown. However, a run of 10 losses lead toward the biggest drawdown (-34%) in mid-1999. As the graph of the ST equity line shows, the portfolio was in a prolonged drawdown phase from mid-1997 until early 2000.
These areas of drawdown are measured by the Ulcer Index. The Ulcer Index was originally devised by Peter Martin in 1987 and described in The Investors Guide to Fidelity Funds: Winning Strategies for Mutual Fund Investors (See http://www.tangotools.com/ui/ui.htm ). The UI differs from Standard Deviation in that it measures risk only on the downside and exposes the risk of sequences of losses. As described by Martin: “Ulcer Index measures the depth and duration of percentage drawdowns in price from earlier highs.”
As a comparison of drawdown, the S&P/TSX Composite Index is shown with its Ulcer Index graphed along with the Stock Trends TSX Portfolio Ulcer Index. The ST Portfolio managed to provide risk protection against the considerable 5-year drawdown after the September 2000 market collapse. This shows us that the buy-and-hold approach exposes investors to higher levels of risk compared to market timing trading systems. Stock Trends promotes the use of trend analysis in the timing of trades not only to generate superior returns, but to also limit downside risk.


Thursday, February 01, 2007
Platinum Group shines
Stock Trends Report on PTM:
http://www.stocktrends.ca/?page=streport&symbol=PTM-T
